| Long-Term Price Case | $75/lb. U308 |
| Flagship Project | Etango |
| Mineral Reserves | 130.1M lbs. |
| Fully Diluted Shares | 1,136,000,844 |
| Fully Diluted Market Cap | $40,896,030 |
| Average Annual Production | 7,059,438 lbs. |
| Recovery | 87% |
| LoM | 16 Years |
| Payable Product | 112,951,000 lbs. |
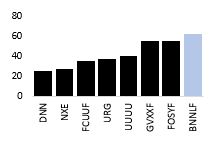
| True All-in Cost (TAIC) | $63.71/lb. |
| Gross Revenue | $8,471,325,000 |
| Royalty | ($423,566,250) |
| Gross Income | $8,047,758,750 |
| Total Operating Costs | ($4,291,071,000) |
| Operating Profit | $3,756,687,750 |
| Income Taxes | ($1,408,757,906) |
| Total Capital Costs | ($1,075,141,000) |
| Net Income | $1,272,788,844 |
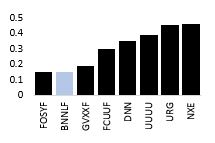
| Net Profit Margin | 15% |
| Absolute Cost Structure (ACS) | 85% |
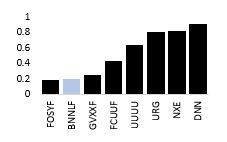
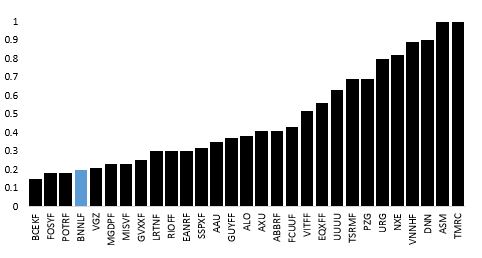
| MTQ Score (Higher is Better) | 0.2 |
| True Value | $1.12/sh. |
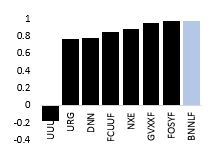
| True Value Discount (TVD) | 97% |
| Cash Flow Multiple | 5x |
| Annual Cash Flow | $79,701,055 |
| Future Market Cap | $398,505,275 |
| Future Market Cap Growth | 874% |
| Target | $0.35/sh. |
Notes: All Values in U.S. Dollars
TAIC Comparison (Lower is Better)
Net Profit Margin Comparison (Higher is Better)
MTQ Score Comparison (Higher is Better)
True Value Discount Comparison (Higher is Better)
MTQ Score — Global Study Group Comparison (Higher is Better)

2 Comments
Hi Tom,
Have you evaluated Global Atomic yet? I would be interested in knowing your thoughts about them. Technically speaking, they seem to have a very strong chart since it bottomed in 2016.
Hi, Bryson,
I have evaluated Global Atomic. I no longer have the workups for it, however. The 2020 Feasibility Study will tell us more. I don’t plan on devoting much time to Global Atomic, however.
Have a great weekend.
Tom