| REVISED (AUSENCO) (20/11/23) | CHANGE | ||
|---|---|---|---|
| Long-Term Price Case | $1,950/oz. Au | $1,950/oz. Au | $1,950/oz. Au |
| Flagship Project | Goliath | Goliath | Goliath |
| Ownership | 100% | 100% | — |
| Mineral Resources (Measured & Indicated) | 2,100,000 ozs. | 2,138,600 ozs. | ↑ |
| Shares Outstanding | 173,000,000 | 177,200,000 | ↑ |
| Market Cap | $31,607,100 | $18,109,840 | ↓ |
| Average Annual Production | 109,000 ozs. | 90,385 ozs. | ↓ |
| Recovery | 92.8% | 92.8% | ↓ |
| Payable Product | 1,314,976 ozs. | 1,175,000 ozs. | ↓ |
| LoM | 13 years | 13 Years | — |
| True All-in Cost (TAIC) | $1,453/oz. | $1,444/oz. | ↓ |
| Gross Revenue | $2,564,203,200 | $2,030,153,000 | ↓ |
| Smelting & Refining | ($4,546,866) | (4,365,920) | ↓ |
| Total Operating Costs | (1,096,552,517) | (1,052,623,418) | ↓ |
| EBITDA | $1,463,103,817 | $973,163,662 | ↓ |
| Royalties | ($38,648,361) | ($37,110,000) | ↓ |
| Total Capital Costs | ($418,311,672) | ($401,664,680) | ↓ |
| Taxes | ($352,150,324) | ($201,000,000) | ↓ |
| Net Income | $653,993,460 | $333,388,982 | ↓ |
| Net Profit Margin | 26% | 16% | ↓ |
| Absolute Cost Structure (ACS) | 74% | 74% | — |
| MTQ Score | 0.4 | 0.2 | ↓ |
| True Value | $3.78/sh. | $1.88/sh. | ↓ |
| True Value Discount | 95% | 95% | — |
| Cash Flow Multiple | 10x | 10x | — |
| Average Net Annual Cash Flow | 50,307,189 | 25,645,306 | ↓ |
| Future Market Cap | 503,071,892 | 256,453,060 | ↓ |
| Future Market Cap Growth | 1,492% | 1,316% | ↓ |
| Target | $2.91/sh. | $1.44/sh. | ↓ |
Notes: All Values in U.S. Dollars


2 Comments
Hey Tom,
Do you still consider this estimation to be valid?
I’ve been reading mixed takes about this company, but I value your opinion higher. Thanks!
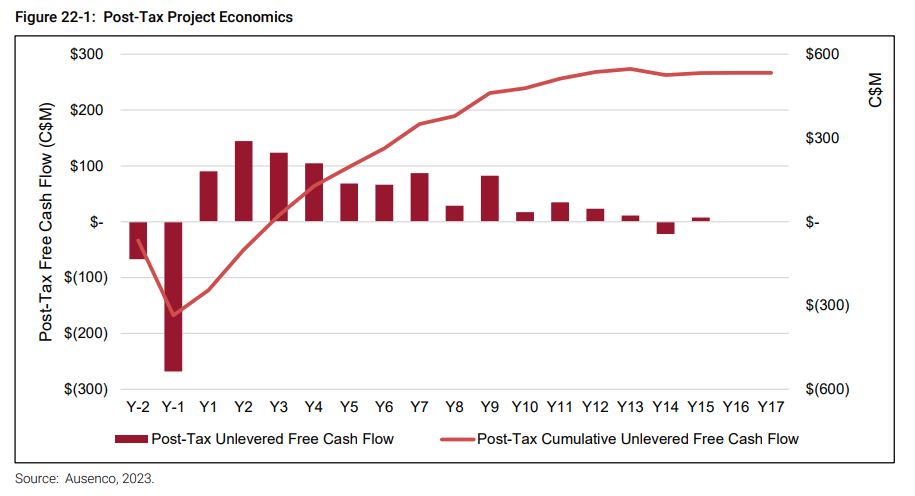
Thank you for writing! Please see our updated economic analysis for Treasury Metals (11/20/23) — https://www.fahy.co/tsrmf-treasury-metals-updated-economic-analysis/. Since our original analysis, Treasury’s market cap has been cut in half. It has a market cap of ~$18M US. We now also have the benefit of a rigorous PFS from which to draw additional data. Average Annual Production is slightly lower, at ~90,000 ozs., which is the chief determining factor in its lower estimated valuation. True All-in Cost at Goliath remains virtually unchanged at $1,444/oz. We still see spectacular value at Treasury, which sports a True Value Discount of 95%, projected Market Cap Growth of 1,316% and a Target Price of $1.44/sh.